March 21, 2011
Older: Give Yourself Constraints
Newer: SSH Tunneling in Ruby
Hi My Name is John...
…and I am addicted to analytics. It all started when I was a wee lad. I quite enjoyed playing Tecmo NBA Basketball, among other games. One day, while rocking the house with Shawn Kemp and the Seattle Supersonics, I noticed that Tecmo NBA basketball did not seem to be correctly recording rebounds.
Obviously, this kind of egregious error was unacceptable. With pad and paper, I began to keep track of rebounds on my own. After each rebound, I would record the stat for the player grabbing it. Yes, I actually paused game play so that I could have correct analytics on rebounds.
The Joys of Blogging
Anyway, fast forward to 2011 where I now operate as a programmer. I could tell you that I grew out of that phase in my life, but alas I have not. From Shortstat, to Mint, and now on to Gaug.es, I have maintained quite a fascination with analytics.
If I am being completely honest, one of the main reasons I blog is to see the views come in after a new post. And oh the joys when it lands on Reddit or HN and brings me people in excess (and lame comments covering how stupid I am).
Graphite and Statsd
The great thing is that on top of websites, I now help maintain several applications. Applications are a fun and tricky beast full of opportunities to record metrics. Most of the time though, these metrics go unrecorded because it is too much work to store and maintain them.
After reading measuring anything and everything by the fine folks at Etsy, I decided it was time to get dirty. I spent a few hours this weekend setting up Graphite and statsd on a small VPS.
Graphite is “enterprise scalable realtime graphing” and statsd, built by Etsy, is a “network daemon for aggregating statistics, rolling them up, then sending them to Graphite”.
Stealing pieces of a gist, I fumbled my way through, and with a little help from Kastner, I was good to go.
UDP
Once I was past the I feel stupid because I have never really setup python or node.js apps before, it was time to start sending my setup some data. statsd speaks UDP, which I have certainly heard about, but never before actually looked into.
UDP is an unreliable, unordered, lightweight protocol for slinging messages around the interwebs. The best way to think of it for those that are unfamiliar is fire and forget. The huge upside of UDP for analytics is that the effect of sprinkling it all over your app is minimal.
You lose a millisecond constructing and sending the message, but if statsd ever goes down, your app does not. You simply lose statistics until it comes back up. Lets look at a simple example.
require 'socket'
socket = UDPSocket.new
socket.send('some message', 0, '127.0.0.1', 33333)
Go ahead and run that. Notice how it doesn’t error? No, it does not magically spin up something in the background. It is fire and forget. The message is sent, but whether or not it makes it to its destination does not matter. Most of the time it will, sometimes it won’t.
I read somewhere that TCP is like a phone call and UDP is like a letter in the mail. Good analogy.
Statsd from Ruby
I started to work on a UDP client for statsd and then realized I should probably check Github before getting too far in. Thankfully, Rein already had a nice little statsd library created.
I felt like it was missing a few things, so I forked it and added a time method that works with blocks and namespacing (so I could track multiple apps from same graphite/statsd install). I have already talked with him and he plans on pulling both. Until then, you can checkout the mine branch on my fork.
Now that I had the server side setup and was armed with a client library, I started to think about what kind of stats I would like to add to Gaug.es. The first thing I could think of was recording each track. I already store an all time number in Mongo, but minute/hour/day data could not hurt.
I created a tiny wrapper around Rein’s library so things would only be tracked in production. I certainly could do this other ways, and probably will, but it worked good enough to get things out the door.
class Stats
cattr_accessor :client
def self.record_stats?
Gauges.environment == 'staging' || Gauges.environment == 'production'
end
def self.increment(*args)
client.increment(*args) if record_stats?
end
def self.decrement(*args)
client.decrement(*args) if record_stats?
end
def self.timing(*args)
client.timing(*args) if record_stats?
end
end
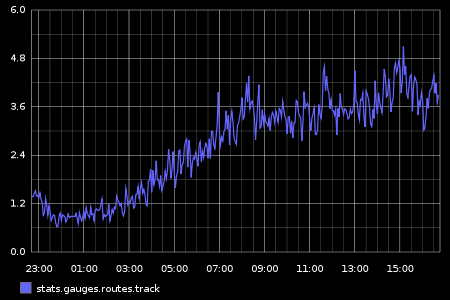
Stats.client = Statsd.new(ipaddr, port)
Stats.client.namespace = 'gauges'Using this, I added an increment to the track route Stats.increment('routes.track'), deployed, and instantly had graphs to play with. Below is tracks per second since last night when I first added the tracking.
Fun Use Case
In Gaug.es, about 75% of the storage is in the contents collection. This collection tracks the views, titles and paths for each site. I was curious what was taking up more space, titles or paths.
Abusing the timing method in statsd, I was able to send the length of the path and title for each piece of content as it was tracked and then get a nice graph of the lower, upper, mean, and upper 90 percentiles.

I noticed right away that some pieces of content were over 600 characters long. This seemed odd, so I started logging the offending pieces of content. I tailed the log for a while and saw that it was Facebook’s fault. :)
For some reason sites using Facebook’s “like” tools end up getting a querying string parameter named fbc_channel, which has a value that is hundreds of characters of json. Awesome.
I created a test case out of the misbehaving content, stripping the fbc_channel param, and deployed a fix. Based on the graph below it is obvious when I pushed out the change.
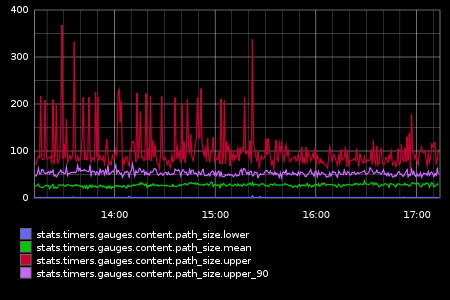
From adding the analytics, to detection, to deploying a fix, only a few minutes flew by. Note that previously I would not have even tracked content path length. I would have never discovered the issue and the sites that had this going on would have continued to have jacked up stats, probably never mentioning it to me.
You have no excuse
I spent a few hours getting things running, but oh the joy I have now. Setup a small VPS or an EC2 micro instance. Install graphite and statsd. Never again wonder. Graph all your theories and improve your apps. That is all for now, I have more metrics to track!

16 Comments
Mar 22, 2011
Lame comment.
Mar 22, 2011
@Robin: Touche.
Mar 22, 2011
@John: I came from hacker news, felt the call of duty.
This is great though, I definitely want to give these tools a try.
Mar 22, 2011
I just had to remove some poorly performing stats code in an app that waited on the IO. I’m definitely going to look into this as I’ve started to become a stats junkie in the past year or so…
It all starts when you decide to track something you built yourself and start watching the charts and start fiddling with stats.
Mar 22, 2011
When you say “track route” what do you actually mean?
Is this where Gauges client ping the server for stats?
Just wondering where you execute the increment in code.
Probably an action in a controller.
Mar 22, 2011
@Mooktakim Ahmed: No this is where all the sites using Gaug.es JavaScript snippet pings. Each time a site gaug.es is tracking loads, it makes a request to /track in our app. Gaug.es uses Sinatra so the increment happens right in the sinatra route.
Mar 22, 2011
hi i am wondering what tools did you use to generate those graphs?
Mar 22, 2011
Should be careful using UDP due to its packet size limit (512 bytes). If you are restrained by how much data you can send in one packet it might be hard to collect everything about a session if you are collecting a lot of different metrics especially impressions, clicks etc. For small analytics it looks awesome though
Mar 22, 2011
Vipul, I think the limit for UDP is closer to 60,000 bytes (http://en.wikipedia.org/wiki/User_Datagram_Protocol#Packet_structure)
Mar 22, 2011
@John: We share a lot in common. I remember playing Tecmo NBA Basketball and being fascinated by the stats (although I was unaware that rebounds were tracked incorrectly!). I used to keep track of my own shooting pct while playing in the driveway. I also am a huge fan of Ruby on Rails. I’m unfamiliar with gaug.es and statsd so I’ll have to check those out. Great post!
Mar 22, 2011
Currently each UPD request is really tiny (<50). I’ve thought about storing stats up in memory and then flushing at the end of the web request. That would be the only time where one would have to worry about UDP limits and it would be easy enough to chunk it into a few requests.
Mar 22, 2011
Vipul, I think you’re thinking of the limit whereby DNS switches from UDP datagrams to TCP once the response size goes over 512 bytes.
http://stackoverflow.com/questions/1098897/what-is-the-largest-safe-udp-packet-size-on-the-internet
Mar 23, 2011
@John, i was working on getting graphite up after reading the first etsy blog post a while back. I saw @kastner speak recently and between this post and his talk, I finally got motivated to push it out. Thanks!
Additionally, for my needs, I also wanted to measure stats around Resque jobs, so I built a plugin last night to do such a thing using your version of the statsd client.
https://github.com/jamster/resque-statsd
Apr 19, 2011
“Applications are a fun and tricky beast full of opportunities to record metrics.” – gosh, I adore your way of treating apps =) and the writing style, as well ;)
Apr 19, 2011
i’m wondering why shortstat (Shaun Inman) and google analytics on my WP blog doesn’t coincide. shortstat records higher page views and visits but analytics doesn’t.
Jun 04, 2011
बहुत बढ़िया पोस्ट. वास्तव में अपने ब्लॉग पोस्ट पढ़ मज़ा आया.
Sorry, comments are closed for this article to ease the burden of pruning spam.