March 05, 2012
Older: More Tiny Classes
Newer: Four Guidelines That I Feel Have Improved My Code
Misleading Title About Queueing
I don’t know about you, but I find it super frustrating when people blog about cool stuff at the beginning of a project, but then as it grows, they either don’t take the time to teach or they get all protective about what they are doing.
I am going to do my best to continue to discuss the strategies we are using to grow Gauges. I hope you find them useful and, by all means, if you have tips or ideas, hit me. Without any further ado…
March 1st of last year (2011), we launched Gauges. March 1st of this year (a few days ago), we finally switched to a queue for track requests. Yes, for one full year, we did all report generation in the track request.
1. In the Beginning
My goal for Gauges in the beginning was realtime. I wanted data to be so freakin’ up-to-date that it blew people’s minds. What I’ve realized over the past year of talking to customers is that sometimes Gauges is so realtime, it is too realtime.
That is definitely not to say that we are going to work on slowing Gauges down. More what it means, is that my priorities are shifting. As more and more websites use Gauges to track, availability moves more and more to the front of my mind.
Gut Detects Issue
A few weeks back, with much help from friends (Brandon Keepers, Jesse Newland, Kyle Banker, Eric Lindvall, and the top notch dudes at Fastest Forward), I started digging into some performance issues that were getting increasingly worse. They weren’t bad yet, but I had this gut feeling they would be soon.
My gut was right. Our disk io utilization on our primary database doubled from January to February, which was also our biggest growth in terms of number of track requests. If we doubled again from February to March, it was not going to be pretty.
Back to the Beginning
From the beginning, Gauges built all tracking reports on the fly in the track request. When a track came in, Gauges did a few queries and then performed around 5-10 updates.
When you are small, this is fine, but as growth happens, updating live during a track request can become an issue. I had no way to throttle traffic to the database. This meant if we had enough large sites start tracking at once, most likely our primary database would say uncle.
As you can guess, if your primary says uncle, you start losing tracking data. In my mind, priority number one is now to never lose tracking data. In order to do this effectively, I felt we were finally at the point where we needed to separate tracking from reporting.
2. Availability Takes Front Seat
My goal is for tracking to never be down. If, occasionally, you can’t get to your reporting data, or if, occasionally, your data gets behind for a few minutes, I will survive. If, however, tracking requests start getting tossed to the wayside while the primary screams for help, I will not.
I talked with some friends and found Kestrel to be very highly recommended, particularly by Eric (linked above). He swore by it, and was pushing it harder than we needed to, so I decided to give it a try.
A few hours later, my lacking JVM skills (Kestrel is Scala) were bearing their head big time. I still had not figured out how to build or run the darn thing. I posted to the mailing list, where someone quickly pointed out that Kestrel defaults to /var for logging, data, etc. and, unfortunately, spits out no error on startup about lacking permissions on OSX. One sudo !! later and I was in business.
3. Kestrel
Before I get too far a long with this fairy tail, let’s talk about Kestrel — what is it and why did I pick it?
Kestrel is a simple, distributed message queue, based on Blaine Cook’s starling. Here are a few great paragraphs from the readme:
Each server handles a set of reliable, ordered message queues. When you put a cluster of these servers together, with no cross communication, and pick a server at random whenever you do a set or get, you end up with a reliable, loosely ordered message queue.
In many situations, loose ordering is sufficient. Dropping the requirement on cross communication makes it horizontally scale to infinity and beyond: no multicast, no clustering, no “elections”, no coordination at all. No talking! Shhh!
It features the memcached protocol, is durable (journaled), has fanout queues, item expiration, and even supports transactional reads.
My favorite thing about Kestrel? It is simple, soooo simple. Sound too good to be true? Probably is, but the honeymoon has been great so far.
Now that we’ve covered what Kestrel is and that it is amazing, let’s talk about how I rolled it out.
4. Architecture
Here is the general idea. The app writes track requests to the tracking service. Workers process off those track requests and generate the reports in the primary database.
After the primary database writes, we send the information through a pusher proxy process, which sends it off to pusher.com, the service that provides all the live web socket goodness that is in Gauges. Below is a helpful sketch:
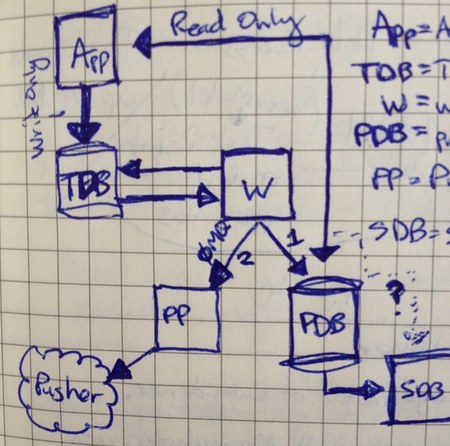
That probably all makes sense, but remember that we weren’t starting from scratch. We already had servers setup that were tracking requests and I needed to ensure that was uninterrupted.
5. Rollout
Brandon and I have been on a tiny classes and services kick of late. What I am about to say may sound heretical, but we’ve felt that we need a few more layers in our apps. We’ve started using Gauges as a test bed for this stuff, while also spending a lot of time reading about clean code and design patterns.
We decided to create a tiny standardization around exposing services and choosing which one gets used in which environment. Brandon took the standardization and moved it into a gem where we could start trying stuff and share it with others. It isn’t much now, but we haven’t needed it to be.
Declaring Services
We created a Registry class for Gauges, which defined the various pieces we would use for Kestrel. It looked something like this:
class Registry
  include Morphine

  register :track_service do
    KestrelTrackService.new(kestrel_client, track_config['queue'])
  end

  register :track_processor do
    KestrelTrackProcessor.new(blocking_kestrel_client, track_config['queue'])
  end
end
We then store an instance of this register in Gauges.app. We probably should have named it Gauges.registry, but we can worry about that later.
At this point, what we did probably seems pointless. The kestrel track service and processor look something like this:
class KestrelTrackService
  def initialize(client, queue)
    @client = client
    @queue  = queue
  end

  def record(attrs)
    @client.set(@queue, MessagePack.pack(attrs))
  end
end

class KestrelTrackProcessor
  def initialize(client, queue)
    @client = client
    @queue = queue
  end

  def run
    loop { process }
  end

  def process
    record @client.get(@queue)
  end

  def record(data)
    Hit.record(MessagePack.unpack(data))
  end
end
The processor uses a blocking kestrel client, which is just a decorator of the vanilla kestrel client. As you can see, all we are doing is wrapping the kestrel-client and making it send the data to the right place.
Using Services
We then used the track_service in our TrackApp like this:
class TrackApp < Sinatra::Base
  get '/track.gif' do
    # stuff
    Gauges.app.track_service.record(track_attrs)
    # more stuff
  end
end
Then, in our track_processor.rb process, we started the processor like so:
Gauges.app.track_processor.runLike any good programmer, I knew that we couldn’t just push this to production and cross our fingers. Instead, I wanted to roll it out to work like normal, but also push track requests to kestrel. This would allow me to see kestrel receiving jobs.
On top of that, I also wanted to deploy the track processors to pop track requests off. At this point, I didn’t want them to actually process those track requests and write to the database, I just wanted to make sure the whole system was wired up correctly and stuff was flowing through it.
Another important piece was seeing how many track request we could store in memory with Kestrel, based on our configuration, and how it performed when it used up all the allocated memory and started going to disk.
Service Magic
The extra layer around tracking and processing proved to be super helpful. Note that the above examples used the new Kestrel system, but that I wanted to push this out and go through a verification process first. First, to do the verification process, we created a real-time track service:
class RealtimeTrackService
  def record(attrs)
    Hit.record(attrs)
  end
end
This would allow us to change the track_service in the registry to perform as it currently was in production. Now, we have two services that know how to record track requests in a particular way. What I needed next was to use both of these services at the same time so I created a multi track service:
class MultiTrackService
  include Enumerable

  def initialize(*services)
    @services = services
  end

  def record(attrs)
    each { |service| service.record(attrs) }
  end

  def each
    @services.each do |service|
      yield service
    end
  end
end
This multi track services allowed me to record to both services for a single track request. The updated registry looked something like this:
class Registry
  include Morphine

  register :track_service do
    which = track_config.fetch(:service, :realtime)
    send("#{which}_track_service")
  end

  register :multi_track_service do
    MultiTrackService.new(realtime_track_service, kestrel_track_service)
  end

  register :realtime_track_service do
    RealtimeTrackService.new
  end

  register :kestrel_track_service do
    KestrelTrackService.new(kestrel_client, track_config['queue'])
  end
end
Note that now, track_service selects which service to use based on the config. All I had to do was update the config to use “multi” as the track service and we were performing realtime track requests while queueing them in Kestrel at the same time.
The only thing left was to beef up failure around the Kestrel service so that it was limited in how it could affect production. For this, I chose to catch failures, log them, and move on as if they didn’t happen.
class KestrelTrackService

  def initialize(client, queue, options={})
    @client = client
    @queue  = queue
    @logger = options.fetch(:logger, Logger.new(STDOUT))
  end

  def record(attrs)
    begin
      @client.set(@queue, MessagePack.pack(attrs))
    rescue => e
      log_failure(attrs, e)
      :error
    end
  end

  private

  def log_failure(attrs, exception)
    @logger.info "attrs: #{attrs.inspect}  exception: #{exception.inspect}"
  end
end
I also had a lot of instrumentation in the various track services, so that I could verify counts at a later point. These verifications counts would prove whether or not things were working. I left that out as it doesn’t help the article, but you definitely want to verify things when you roll them out.
Now that the track service was ready to go, I needed a way to ensure that messages would flow through the track processors without actually modifying data. I used a similar technique as above. I created a new processor, aptly titled NoopTrackProcessor.
class NoopTrackProcessor < KestrelTrackProcessor
  def record(data)
    # don't actually record
    # instead  just run verification
  end
end
The noop track processor just inherits from the kestrel track processor and overrides the record method to run verification instead of generating reports.
Next, I adjusted the registry to allow flipping the processor that is used based on the config.
class Registry
  include Morphine

  register :track_processor do
    which = track_config.fetch(:processor, :noop)
    send("#{which}_track_processor")
  end

  register :kestrel_track_processor do
    KestrelTrackProcessor.new(blocking_kestrel_client, track_config['queue'])
  end

  register :noop_track_processor do
    NoopTrackProcessor.new(blocking_kestrel_client, track_config['queue'])
  end
end
With those changes in place, I could now set the track service to multi, the track processor to noop, and I was good to deploy. So I did. And it was wonderful.
6. Verification
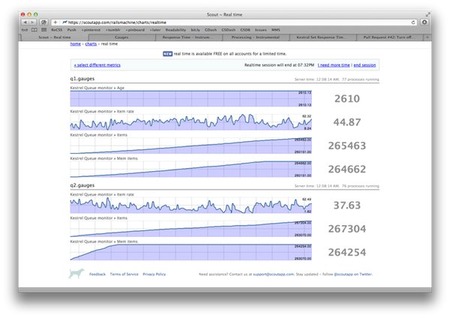
For the first few hours, I ran the multi track service and turned off the track processors. This created the effect of queueing and never dequeueing. The point was to see how many messages kestrel could hold in memory and how it performed once messages started going to disk.
I used scout realtime to watch things during the evening while enjoying some of my favorite TV shows. A few hours later and almost 530k track requests later, Kestrel hit disk and hummed along like nothing happened.
Now that I had a better handle of Kestrel, I turned the track processors back on. Within a few minutes they had popped all the messages off. Remember, at this point, I was still just noop’ing in the track processors. All reports were still being built in the track request.
I let the multi track service and noop track processors run through the night and by morning, when I checked my graphs, I felt pretty confident. I removed the error suppression from the kestrel service and flipped both track service and track processor to kestrel in the config.
One more deploy and we were queueing all track requests in Kestrel and popping them off in the track processors after which, the reports were updated in the primary database. This meant our track request now performed a single Kestrel set, instead of several queries and updates. As you would expect, response times dropped like a rock.
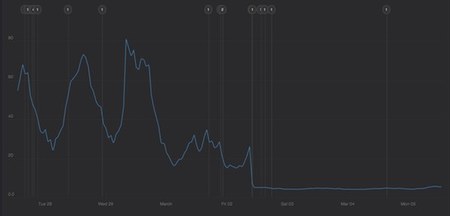
It is pretty obvious when Kestrel was rolled out as the graph went perfectly flat and dropped to ~4ms response times. BOOM.
You might say, yeah, your track requests are now fast, but your track processors are doing the same work that the app was doing before. You would be correct. Sometimes growing is just about moving slowness into a more manageable place, until you have time to fix it.
This change did not just move slowness to a different place though. It separated tracking and reporting. We can now turn the track processors off, make adjustments to the database, turn them back on, and instantly, they start working through the back log of track requests queued up while the database was down. No tracking data lost.
I only showed you a handful of things that we instrumented to verify things were working. Another key metric for us, since we aim to be as close to realtime as possible, is the amount of time that it takes to go from queued to processing.
Based on the numbers, it takes us around 500ms right now. I believe as long as we keep that number under a second, most people will have no clue that we aren’t doing everything live.
7. Conclusion
By no means are we where I want us to be availability-wise, but at least we are one more step in the right direction. Hopefully this article gives you a better idea how to roll things out into production safely. Layers are good. Whether you are using Rails, Sinatra, or some other language entirely, layer services so that you can easily change them.
Also, we are now a few days in and Kestrel is a beast. Much thanks to Robey for writing it and Twitter for open sourcing it!

13 Comments
Mar 05, 2012
Great post. I agree with you that people should share their learning even after the honeymoon with some new tech has worn off, or they are doing cool, secret stuff.
The legend in the sketch you shared is cut off. What is app, TDB, PDB, SDB, and PP? Where does ZeroMQ come into play (I’ve been reading up on ZMQ lately)?
How does Kestrel compare to something like RabbbitMQ? I assume it’s the “simple” and “distributed” aspects of Kestrel, as well as being specialized to a message queue rather than addressing messaging in general. It also sounds like Resque could be suited to this work. Can you share a bit more about how you chose Kestrel and how it may stack up to other software in this space? (Eric Lindvall, feel free to weigh in.)
Thanks for the post, and keep them coming. I’m also trying to learn and apply better object-oriented design in my work.
Alex
Mar 05, 2012
@Alex: We have one pusher_proxy.rb process running on each app server. It is an event machine server that binds to ZMQ::PULL socket. When it receives a payload, it forwards it to pusher using the pusher gem’s trigger_async method, which uses em-http-request. We then use ZMQ::PUSH sockets in the workers to send messages to those processes.
I can’t speak to RabbitMQ or the like, but Eric had used it previously and much preferred Kestrel. As to why we chose it over Resque, Resque uses Redis, which doesn’t really have any good high availability options.
With Kestrel, if a server goes down, the clients just shift to different servers. Also, resque forks does some things to prevent memory leaks and such which limit the number of jobs it can really perform. Sure you can get around it, but we were more concerned with just pure speed. Using the blocking kestrel client in a loop is pretty darn fast.
Mar 05, 2012
Which tool do you use for that response time graph (last picture in the post)?
Mar 05, 2012
One other side question: What’s the reasoning behind the pusher proxy? I have a few guesses but would rather just ask.
Mar 06, 2012
+1 for the response time graph question.
Mar 06, 2012
@Brendon: We send a lot of pusher requests. It is a lot of IO, so we use event machine to do the sending. Also makes sure that pusher slowing down or going down affects our storage in no way.
@tom: We use Instrumental for the amazing graphs. Fantastic service.
Mar 06, 2012
Regarding the pusher proxy, that makes sense. I’ve only used it in smaller apps on Heroku (so inside thin), and have just been inlining the trigger_async calls appside. However, it makes me wonder, what exceptions I might see if Pusher or the path went temporarily unreachable; that is definitely worth isolating against and I hadn’t previously thought much on that.
Going to test those exceptions shortly, thanks!
Mar 06, 2012
@Brendon: if you are using thin on heroku, you are fine. It will just fail silently and won’t hurt response time really. We are running passenger in production, which is not evented and therefore trigger async isn’t available.
We were running event machine in a thread and doing trigger async, but eventually that doesn’t get super happy either.
Granted we are talking thousands a minute, not one once in a while. It certainly held up longer than I thought it would. Probably would have lasted longer but I chose to just move it out to another process.
Mar 05, 2012
I think you need not worry about perceived heresies; these smaller classes with short methods are way nicer to read and test than a giant god class. I can look at these code snippets here and know exactly what you are doing. Thanks for the inspiration.
Side note: the comment preview here is nice!
Mar 05, 2012
Cool stuff John – one of the beasts for metrics apps like Guages is that you’re processing lots of data even though 95% of your customers aren’t viewing it at any single time.
One of the strategies we’ve deployed at Scout is fast-tracking data for accounts that are using the web UI. It’s far less efficient than importing data in bulk, but since only a small % are viewing the UI at one, the performance impact is insignificant.
Mar 06, 2012
@Derek: Yeah, great idea. Thanks for posting. Not sure how we would apply it currently, but gives me stuff to think about for the future.
We do it a bit already with pusher. We occupy and vacate gauges and then only send pusher requests for occupied gauges. Cut down the pusher traffic significantly.
Mar 09, 2012
Thanks for the detail, its great to see an insight into how things work like this.
It looks like you’re using Scout to monitor your app/servers, but as tom asked, what are you using for that final graph, with the annotations?
Thanks.
Mar 09, 2012
@Matthew: The dark graph is from instrumental. Fantastic service by some friends of mine.
Sorry, comments are closed for this article to ease the burden of pruning spam.